Completed payoff reference workbook
Seven invented positions with full quantities, explicit extra cost and original gross stop-risk denominators.
Freeze the measurement contract
All seven records are invented alternatives, not observed positions or a portfolio sequence. Each has one original entry, a loss-side reference stop, whole original quantity, a positive linear cash multiplier, three possible exit rows and additional total cash cost. The exits completely reconcile to the original quantity. No position remains open. Zero-quantity rows are unused, with a valid price reference retained; they are not missing executions assumed flat. There is no actual instrument, transaction time, financing, currency conversion, tax or account funding source.
The original gross planned stop risk is quantity times loss-side stop distance times multiplier. Additional cash cost is not in that denominator and is charged once in net P&L. That is the declared R convention, not a universal risk rule. Changing a stop later would not change this original denominator. A real approved policy can use another convention but needs a separately identified record. Every number here can be reproduced without treating the reference stop as a guaranteed transaction or assuming the hypothetical exits are available.
Trace the quantity-weighted cases
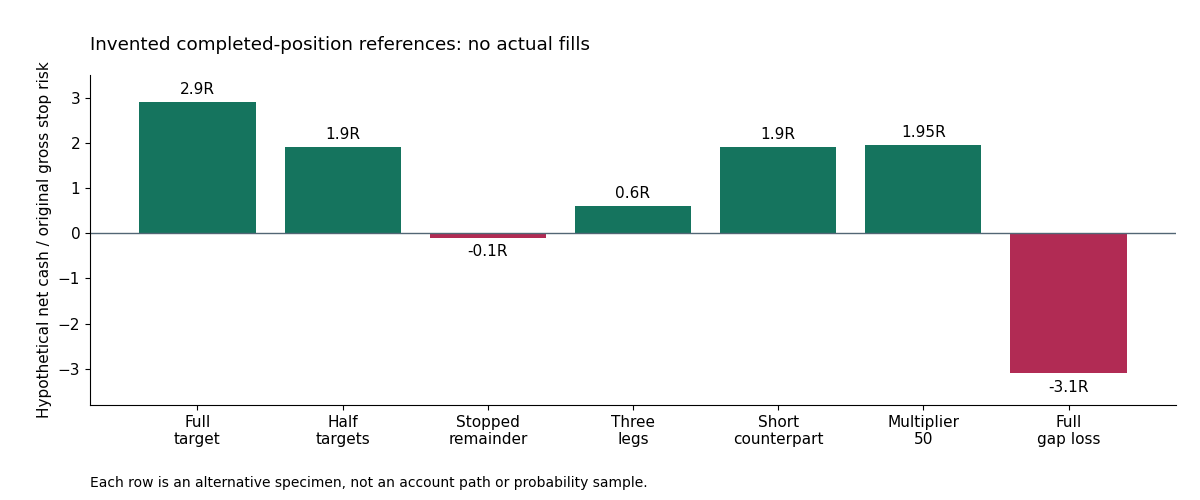
The long entry is 100 and stop reference 98. Full quantity 100 at assumed exit 106 earns 600 gross; cost 20 leaves 580 and 2.9R on original risk 200. Half at 102 and half at 106 earns 400 gross, 380 net and 1.9R. Changing the second half exit to 98 makes gross cash zero and net negative 20, or negative 0.1R. The displayed furthest target is not credited to all units in the half-exit record, and a profitable first leg does not establish a net-winning whole position.
The three-leg row exits 40 at 102, 30 at 106 and 30 at 96. Contributions are 80, 180 and negative 120, giving gross 140 and net 120, or 0.6R. The short counterpart instead uses entry 100, stop 102 and two exits of 50 at 98 and 94; signed gross cash is 400 and net R 1.9. It illustrates directional arithmetic only. No short-sale availability, borrowing fee, funding or executed transaction is established by reversing the price sign.
Keep units and gap assumptions explicit
The multiplier row has four units, entry 100, stop 98, two exits at 102 and two at 106, multiplier 50 and extra cash cost 20. Original gross risk is 400. Gross P&L is 800, leaving 780 or 1.95R net. A common positive multiplier preserves a clean price-distance ratio but changes cash exposure and the R effect of a separately stated cash fee. It is an assumed linear contract, not an actual named specification or margin quote. Nonlinear products are outside the worksheet.
The gap row exits the whole original 100 long units at an assumed 94, giving gross negative 600 and net negative 620, or negative 3.1R on the unchanged 200 risk denominator. It is a stress assumption, not a tail frequency or maximum possible loss. The seven rows have no probability weights. Adding their R values would not create a trading return because the rows are alternative examples. Account marks, capital, external flows and overlapping holdings would be needed for an actual equity measure.
Independent arithmetic without stronger assurance
Python standard-library Decimal generates the public reference JSON, CSV and labelled figure independently of the browser calculation engine. A larger private correctness grid checks directions, distances, quantities, multipliers and costs; invalid cases check missing fields, zero risk and incomplete exit quantities. Those are software tests, not independently validated market observations. A public dataset format and precise answer do not provide a real strategy ledger, broker fill or external audit.
The downloads contain the same complete specimen inputs and results. The interactive three-leg tool starts from the half-target case and rejects open or over-exited quantities rather than inventing a closing amount. The original price tool, R-branch worksheet, completed-series analyser, evidence record and long protocols remain available. An actual payoff review still needs original records, cost inclusion, effective policy and full population. Source gaps are carried into visible text and machine mirrors rather than hidden behind a stronger promotional summary.
Complete alternative records
| Case | Direction | Quantity | Multiplier | Original risk cash | Gross cash | Net cash | Net R |
|---|---|---|---|---|---|---|---|
| Full target | long | 100 | 1 | 200.0 | 600.0 | 580.0 | 2.9 |
| Half at each target | long | 100 | 1 | 200.0 | 400.0 | 380.0 | 1.9 |
| First target, stopped remainder | long | 100 | 1 | 200.0 | 0.0 | -20.0 | -0.1 |
| Three-leg mixed exit | long | 100 | 1 | 200.0 | 140.0 | 120.0 | 0.6 |
| Short two-target counterpart | short | 100 | 1 | 200.0 | 400.0 | 380.0 | 1.9 |
| Linear multiplier 50 | long | 4 | 50 | 400.0 | 800.0 | 780.0 | 1.95 |
| Full gap loss | long | 100 | 1 | 200.0 | -600.0 | -620.0 | -3.1 |
Quantity-weighted exit rows
| Case | Leg | Exit quantity | Exit price | Gross cash contribution |
|---|---|---|---|---|
| Full target | 1 | 100 | 106 | 600.0 |
| Half at each target | 1 | 50 | 102 | 100.0 |
| Half at each target | 2 | 50 | 106 | 300.0 |
| First target, stopped remainder | 1 | 50 | 102 | 100.0 |
| First target, stopped remainder | 2 | 50 | 98 | -100.0 |
| Three-leg mixed exit | 1 | 40 | 102 | 80.0 |
| Three-leg mixed exit | 2 | 30 | 106 | 180.0 |
| Three-leg mixed exit | 3 | 30 | 96 | -120.0 |
| Short two-target counterpart | 1 | 50 | 98 | 100.0 |
| Short two-target counterpart | 2 | 50 | 94 | 300.0 |
| Linear multiplier 50 | 1 | 2 | 102 | 200.0 |
| Linear multiplier 50 | 2 | 2 | 106 | 600.0 |
| Full gap loss | 1 | 100 | 94 | -600.0 |
Filled references and retained tools
Download filled reference CSV | Download complete reference JSON